Social Media Analytics: The Metrics That Actually Matter for Business Growth

Most social media reporting is a theater of vanity metrics. Follower counts, likes, impressions — these numbers look impressive in monthly reports and mean almost nothing for actual business outcomes. The shift from vanity metric tracking to meaningful analytics is one of the most important evolutions in modern digital marketing — and most brands haven’t made it yet. This guide explains which social media metrics actually predict business growth, how to connect social performance to revenue, and how to build a reporting framework that earns executive confidence instead of raising questions.
The Vanity Metric Problem
Vanity metrics are data points that feel significant but don’t connect to business outcomes. They exist because they’re easy to measure, tend to go up over time (making teams look good), and are familiar enough that few stakeholders question them. The problem is that they can move in positive directions while actual business impact is flat or declining.
Common Vanity Metrics and Why They Mislead
| Metric | Why It’s a Vanity Metric | What to Track Instead |
|---|---|---|
| Follower count | Doesn’t predict engagement, reach, or revenue | Follower growth rate + quality |
| Total impressions | Includes repeat views, bot traffic, zero intent | Unique reach + frequency |
| Total likes | No correlation with business outcomes | Saves, shares, link clicks |
| Total post reach | Doesn’t indicate content quality or resonance | Engagement rate, click-through rate |
| Video views | Platform definitions vary (3 seconds = view on most) | Video completion rate, ThruPlay |
The Metrics Framework That Connects to Business Outcomes
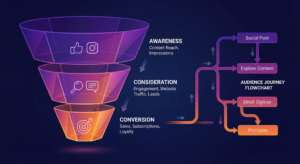
A meaningful social media analytics framework maps metrics to the stages of your business funnel: awareness, consideration, conversion, and retention.
Awareness Metrics That Matter
At the awareness stage, the goal is reaching the right audience — not just any audience. Track unique reach among target audience (available through most paid social platforms with audience targeting), share of voice (your brand’s mentions relative to competitors, trackable via Brandwatch, Mention, or Sprout Social), and branded search volume (Google Search Console shows whether social activity is driving incremental branded searches — a strong indicator of awareness impact).
Engagement Metrics That Predict Conversion
Not all engagement signals are equal. Saves and shares indicate genuine content value. Click-through rate to your website indicates content relevance to your offer. Video completion rate above 50% indicates strong content quality. Engagement rate (engagements / reach, not engagements / followers) provides a true measure of content resonance with the people who actually saw it — the follower-based calculation inflates performance for large accounts.
Conversion Metrics: Closing the Loop
This is where most social media analytics fail — the gap between social engagement and business conversion. Bridge this gap through: UTM parameters on every social link (enabling GA4 attribution of website conversions to specific social content), social-assisted conversions (conversions where social was a touchpoint even if not the last click — visible in multi-touch attribution models), and click-to-lead / click-to-purchase rates from social traffic specifically. Platform-specific conversion APIs (Meta Conversions API, TikTok Events API) improve attribution accuracy in cookieless environments.
Platform-Specific Analytics Priorities
Each social platform has distinct metrics that carry more predictive weight for performance.
Meta (Facebook + Instagram)
For organic: Reach, saves, profile visits, and website clicks. For paid: Cost per result, purchase ROAS, frequency (above 3–4 signals audience fatigue), and landing page view rate (LPV rate shows what percentage of link clicks actually load your landing page — below 70% indicates landing page speed issues).
For B2B brands, LinkedIn’s most valuable metrics are: post engagement rate, click-through rate, profile visits (leading indicator of purchase intent), and follower demographics (confirming you’re reaching your target audience). LinkedIn’s lead gen form open and submit rates are more relevant than CPC for campaigns with lead objectives.
TikTok
Video completion rate is TikTok’s most important organic metric — it directly signals algorithm distribution. For ads, track CPM trends (rising CPM signals audience saturation), video play at 50%, and click-through rate to landing page. TikTok’s attribution window is typically shorter than Meta’s, so adjust comparison benchmarks accordingly.
Building a Social Media Reporting Framework
The purpose of a reporting framework is to enable better decisions, not to document past activity. Good reporting answers “what should we do next?” as much as “what happened?”
The Three-Layer Dashboard
Structure your social media reporting in three layers: executive summary (3–5 business-outcome metrics: revenue attributed, leads generated, cost per acquisition, brand sentiment trend), performance summary (platform-by-platform engagement quality, CTR, and top-performing content), and diagnostic layer (detailed metrics for troubleshooting — audience fatigue indicators, creative performance breakdown, posting time analysis). Different stakeholders need different layers.
Benchmarking: Against Yourself First
Industry benchmarks are useful directional references, but your own historical performance is your most relevant benchmark. Track month-over-month and year-over-year trends for your key metrics. Improving your own engagement rate from 2% to 2.8% is more meaningful than comparing to an industry average that may not represent your specific audience, content type, or posting frequency.
Attribution for Imperfect Worlds
Perfect attribution doesn’t exist. Social media’s influence on purchase decisions is frequently real but difficult to measure directly — dark social (direct traffic from social sharing), view-through conversions, and awareness impact on branded search all create value that standard last-click attribution misses. Build your reporting framework to acknowledge this complexity rather than pretending last-click attribution tells the whole story. Incrementality testing (holdout tests) is the gold standard for measuring true social media impact.
Frequently Asked Questions
What social media metrics should I report to leadership?
Lead with business outcomes: revenue or leads attributed to social, cost per acquisition, and share of voice or brand sentiment. Follow with efficiency metrics: reach among target audience, CTR, and engagement rate. Avoid leading with follower counts or total impressions — these signal social media team effort, not business impact.
How do I track conversions from social media accurately?
Use UTM parameters on every external link shared on social media (Google UTM builder makes this easy), install platform pixel/events APIs for server-side tracking, enable GA4 multi-touch attribution, and set up social-specific conversion goals in your analytics platform. No single tracking method is perfect — use multiple overlapping signals.
What’s a good engagement rate on social media in 2026?
Averages vary dramatically by platform, account size, and industry. On Instagram, 1–3% is average for larger accounts; 3–6% is strong. On LinkedIn, 1–2% is average; 3%+ is strong. On TikTok, 4–8% is average due to the algorithm’s content-first distribution. Compare yourself to your own historical performance first.
How often should I produce social media reports?
Weekly reports for internal team use (campaign performance, content learnings), monthly reports for management (trend analysis, strategic recommendations), quarterly for leadership (business impact, competitive positioning). Avoid daily reporting unless actively running experimental campaigns — daily data is too noisy for meaningful decisions.
Conclusion
The organizations that extract real business value from social media in 2026 are those that have made the discipline of measuring outcomes — not activities — central to their strategy. Stop reporting follower counts to executives who rightfully don’t care about them. Build a metrics framework that connects social media performance to awareness, consideration, conversion, and retention outcomes. Use attribution honestly, benchmark against your own history, and make reporting answer the question that actually matters: what should we do differently? That’s when social media analytics becomes a strategic advantage rather than a monthly compliance exercise.